ESG Data
Environment
Greenhouse Gas (GHG) Emissions
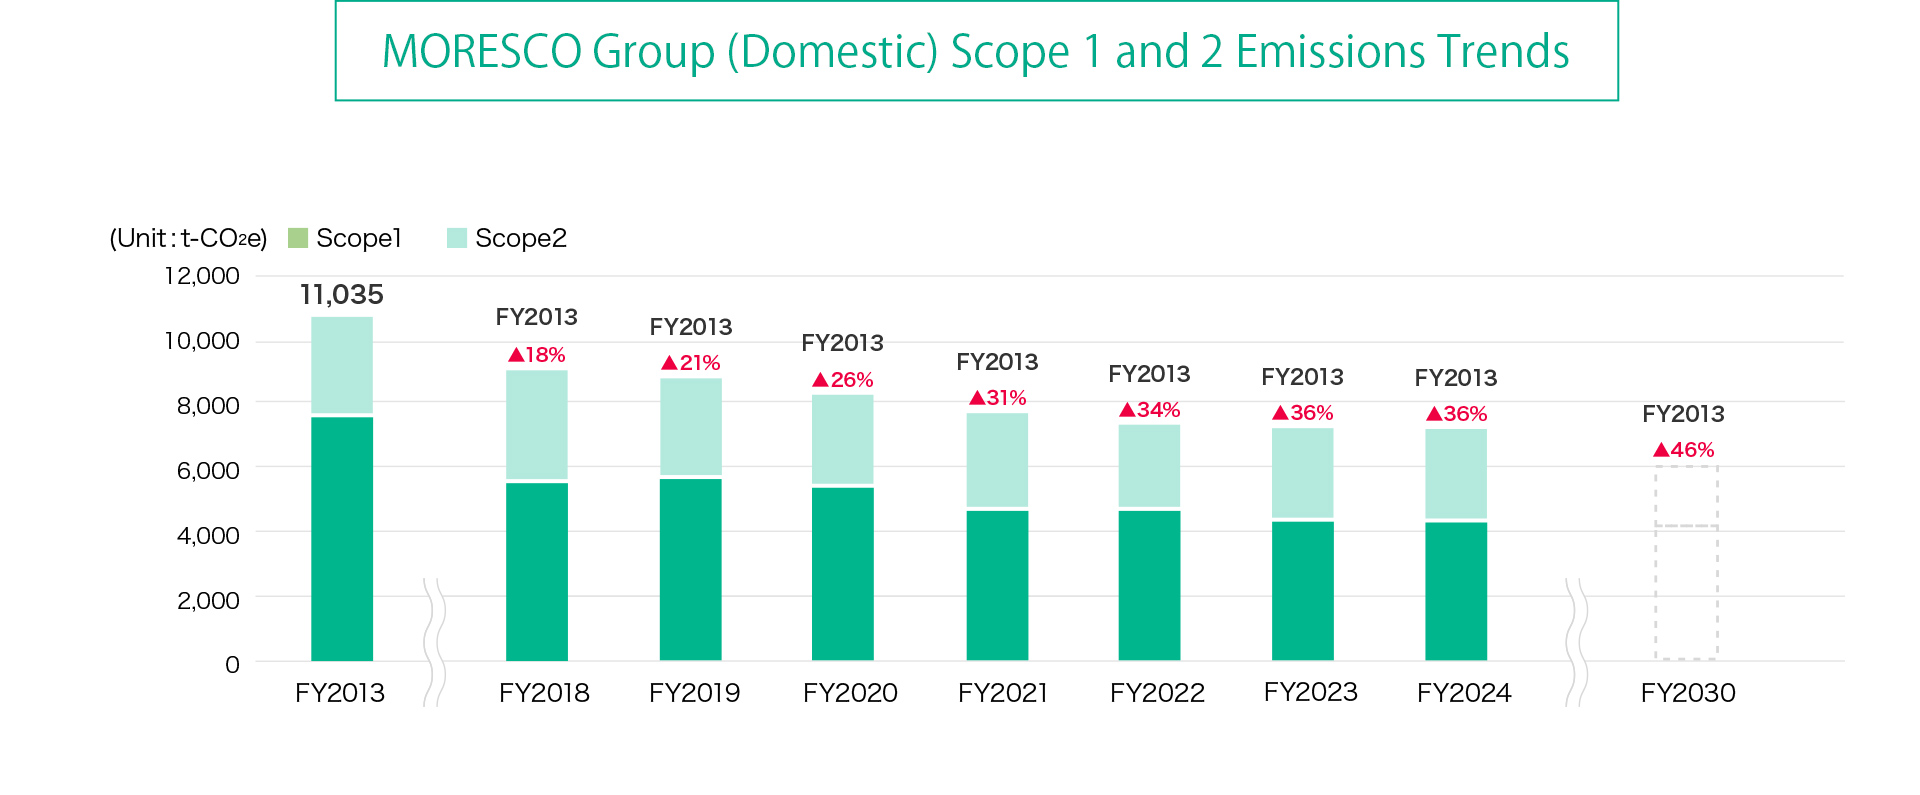
Scope 1 and 2 emissions(Unit:t-CO2e)
| FY2013 | FY2020 | FY2021 | FY2022 | FY2023 | FY2024 | FY2025 | |
|---|---|---|---|---|---|---|---|
| Scope1 | 7,712 | 5,438 | 4,794 | 4,640 | 4,289 | 4,295 | 4,100 |
| Scope2 | 3,322 | 2,716 | 2,827 | 2,662 | 2,815 | 2,810 | 1,129 |
| Total Scope 1 and Scope 2 emissions (Reduction ratio compared to FY2013) |
11,035 | 8,154 (26%) |
7,621 (31%) |
7,302 (34%) |
7,104 (36%) |
7,105 (36%) |
5,229 (53%) |
*Scope of calculation covers domestic locations for MORESCO Corporation and its consolidated subsidiaries.
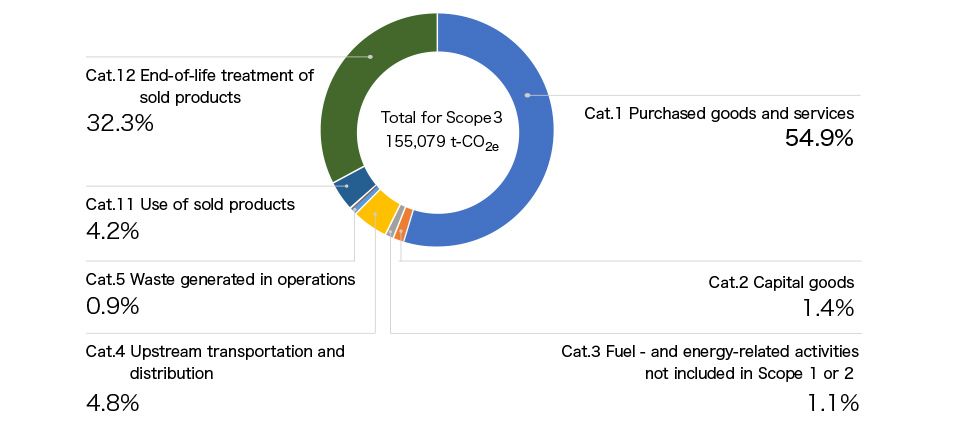
Scope 3 emissions(Unit:t-CO2e)
| Category | FY2024 | Ratio |
|---|---|---|
| 1. Purchased goods and services | 85,123 | 54.9% |
| 2. Capital goods | 2,235 | 1.4% |
| 3. Fuel- and energy-related activities not included in Scope 1 or 2 | 1,765 | 1.1% |
| 4. Upstream transportation and distribution | 7,422 | 4.8% |
| 5. Waste generated in operations | 1,401 | 0.9% |
| 6. Business travel | 61 | 0.0% |
| 7. Employee commuting | 150 | 0.1% |
| 8. Upstream leased assets | ‐ | ‐ |
| 9. Downstream transportation and distribution | 195 | 0.1% |
| 10. Processing of sold products | ‐ | ‐ |
| 11. Use of sold products | 6,589 | 4.2% |
| 12. End-of-life treatment of sold products | 50,138 | 32.3% |
| 13. Downstream leased assets | ‐ | ‐ |
| 14. Franchises | ‐ | ‐ |
| 15. Investments | ‐ | ‐ |
| Total for Scope 3 | 155,079 | 100.0% |
*Scope of calculation covers domestic locations for MORESCO Corporation and its consolidated subsidiaries.
*Categories 8, 10, 13, 14, and 15 are excluded as there are no relevant activities.
*Emissions intensity databases used for calculations included IDEA ver. 3.4 (National Institute of Advanced Industrial Science and Technology) and the Basic Guidelines on Accounting for Greenhouse Gas Emissions Throughout the Supply Chain ver. 3.4 (Ministry of the Environment).
GHG Emission Reduction Targets
| Target | Boundary | Target Fiscal Year | Level | |
|---|---|---|---|---|
Goal 1 |
Scope 1+2 emissions |
MORESCO domestic group companies (consolidated) |
FY2030 |
46% reduction (compared to FY2013) |
Goal 2 |
Scope 1+2 emissions |
MORESCO domestic group companies (consolidated) |
FY2050 |
Carbon neutral |
Society
- Number of employees/directors
- Number of managers
- New graduate hires (staff/high school graduates and above)
- Mid-career hires (staff)
- Mid-career hires (contract employees including temporary employees)
- Number of employees who left the company (staff)
- Number of employees who left the company (contract employees including temporary employees)
- Number of foreign employees
| FY2023On 29 February 2024 | FY2024On 28 February 2025 | FY2025On 28 February 2026 | ||||||
|---|---|---|---|---|---|---|---|---|
| Number of people |
Percentage | Number of people |
Percentage | Number of people |
Percentage | |||
| Number of employees | Total | Male | 310 | 80.1% | 289 | 77.7% | 291 | 77.8% |
| Female | 77 | 19.9% | 83 | 22.3% | 83 | 22.2% | ||
| Subtotal | 387 | 100.0% | 372 | 100.0% | 374 | 100.0% | ||
| Staff *1 | Male | 278 | 81.0% | 259 | 79.0% | 257 | 79.1% | |
| Female | 65 | 19.0% | 69 | 21.0% | 68 | 20.9% | ||
| Subtotal | 343 | 100.0% | 328 | 100.0% | 325 | 100.0% | ||
| 10s | 0 | 0.0% | 0 | 0.0% | 0 | 0.0% | ||
| 20s | 50 | 14.6% | 43 | 13.1% | 39 | 12.0% | ||
| 30s | 93 | 27.1% | 88 | 26.8% | 88 | 27.1% | ||
| 40s | 110 | 32.1% | 108 | 32.9% | 108 | 33.2% | ||
| 50s | 88 | 25.7% | 86 | 26.2% | 87 | 26.8% | ||
| 60s*2 | 2 | 0.6% | 3 | 0.9% | 3 | 0.9% | ||
| 70s | 0 | 0.0% | 0 | 0.0% | 0 | 0.0% | ||
| Subtotal | 343 | 100.0% | 328 | 100.0% | 325 | 100.0% | ||
| Contract employees including temporary employees | Male | 32 | 72.7% | 30 | 68.2% | 34 | 69.4% | |
| Female | 12 | 27.3% | 14 | 31.8% | 15 | 30.6% | ||
| Subtotal | 44 | 100.0% | 44 | 100.0% | 49 | 100.0% | ||
| 10s | 0 | 0.0% | 0 | 0.0% | 1 | 2.0% | ||
| 20s | 2 | 4.5% | 3 | 6.8% | 3 | 6.1% | ||
| 30s | 4 | 9.1% | 3 | 6.8% | 4 | 8.2% | ||
| 40s | 4 | 9.1% | 3 | 6.8% | 3 | 6.1% | ||
| 50s | 6 | 13.6% | 5 | 11.4% | 6 | 12.2% | ||
| 60s | 25 | 56.8% | 28 | 63.6% | 31 | 63.3% | ||
| 70s | 3 | 6.8% | 2 | 4.5% | 1 | 2.0% | ||
| Subtotal | 44 | 100.0% | 44 | 100.0% | 49 | 100.0% | ||
| Number of directors | Male | 9 | 90% | 9 | 90.0% | 9 | 90.0% | |
| Female | 1 | 10% | 1 | 10.0% | 1 | 10.0% | ||
| Subtotal | 10 | 100.0% | 10 | 100.0% | 10 | 100.0% | ||
| Number of managers*3 | Male | 76 | 90.5% | 68 | 88.3% | 67 | 90.5% | |
| Female | 8 | 9.5% | 9 | 11.7% | 7 | 9.5% | ||
| Subtotal | 84 | 100.0% | 77 | 100.0% | 74 | 100.0% | ||
| New graduate hires (staff/high school graduates and above) |
Male | 5 | 83.3% | 1 | 33.3% | 2 | 66.7% | |
| Female | 1 | 16.7% | 2 | 66.7% | 1 | 33.3% | ||
| Subtotal | 6 | 100.0% | 3 | 100.0% | 3 | 100.0% | ||
| Mid-career hires (staff)*4 | Male | 13 | 92.9% | 4 | 57.1% | 10 | 76.9% | |
| Female | 1 | 7.1% | 3 | 42.9% | 3 | 23.1% | ||
| Subtotal | 14 | 100.0% | 7 | 100.0% | 13 | 100.0% | ||
| Mid-career hires (contract employees including temporary employees) |
Male | 11 | 100.0% | 5 | 71.4% | 4 | 50.0% | |
| Female | 0 | 0.0% | 2 | 28.6% | 4 | 50.0% | ||
| Subtotal | 11 | 100.0% | 7 | 100.0% | 8 | 100.0% | ||
| Number of employees who left the company (staff)*5 | Male | 14 | 82.4% | 19 | 90.5% | 12 | 70.6% | |
| Female | 3 | 17.6% | 2 | 9.5% | 5 | 29.4% | ||
| Subtotal | 17 | 100.0% | 21 | 100.0% | 17 | 100.0% | ||
| Number of employees who left the company (contract employees including temporary employees) |
Male | 13 | 92.9% | 5 | 83.3% | 4 | 80.0% | |
| Female | 1 | 7.1% | 1 | 16.7% | 1 | 20.0% | ||
| Subtotal | 14 | 100.0% | 6 | 100.0% | 5 | 100.0% | ||
| Number of foreign employees*6 | Male | 5 | 1.6% | 4 | 1.4% | 4 | 1.4% | |
| Female | 3 | 3.9% | 3 | 3.6% | 3 | 3.6% | ||
| Subtotal | 8 | 2.1% | 7 | 1.9% | 7 | 1.9% | ||
*1 Number of employees: Excluding employees seconded to domestic and overseas group companies
*2 Staff in their 60s are those who will retire at the end of the fiscal year.
*3 Including professionals
*4 Mid-career hires do not include the first year of rehiring.
*5 The number of employees who left the company does not include those who retired at the mandatory retirement age or expired rehired.
*6 Ratio to total number of employees
| FY2023 | FY2024 | FY2025 | ||
|---|---|---|---|---|
| Mid-career hiring ratio*1 | 75.0% | 79.0% | TBC | |
| Turnover rate (staff with fewer than 3 years of employment) |
4.4% | 5.4% | 4.8% | |
| Female management occupancy rate | 9.5% | 11.7% | 9.5% | |
| Number of female employees among new graduate hires*2 | 16.7% | 66.7% | 33.3% | |
| Per capita training costs | 51,000 yen | 58,000 yen | 54,000 yen | |
| Rate of taking annual paid leave | 75.8% | 74.7% | 74.0% | |
| Number of childcare leave recipients | Male | 7 | 7 | 8 |
| Female | 3 | 2 | 2 | |
| Subtotal | 10 | 9 | 10 | |
*1 Ratio of mid-career hires to employees hired during the fiscal year
*2 High school graduates and above